Tobin Q
The Q-Ratio is just the total value of the stock market (numerator) relative to the total net worth of the companies that comprise it (denominator). The data is provided quarterly by the Fed.
When the Q-Ratio is very low, stocks, as a group, are inexpensive relative to their replacement cost. Conversely, when the ratio is very high, stocks are relatively expensive in this regard.
However, Spitznagel shows that when you separate the historical record of the ratio into quartiles and compare forward returns to the risk-free rate, stocks have performed very poorly after very high q-ratio readings. They also performed very well after very low q-ratio readings. Once again, it turns out that, “the price you pay determines your rate of return,” is validated by the data.
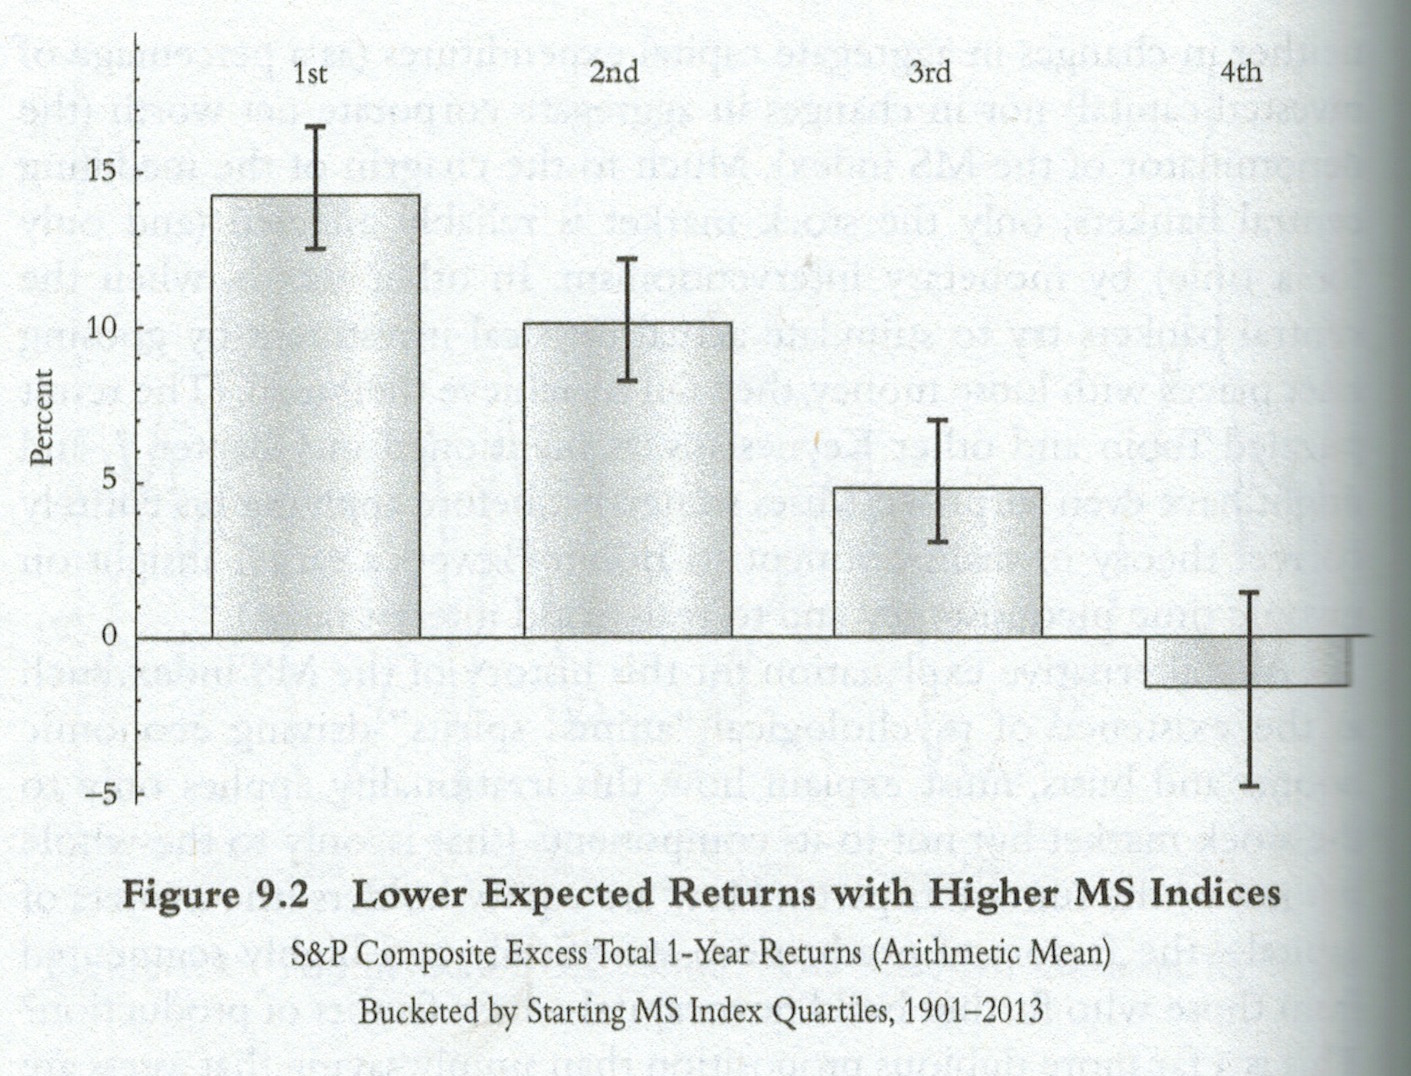
Additionally, when the Q-Ratio has been very high, as it is today, the size of the subsequent drawdowns were much larger than those following low readings in the ratio. In other words, when stocks become largely very expensive, as they are today (see the chart at the top of this post) we should come to expect large losses.
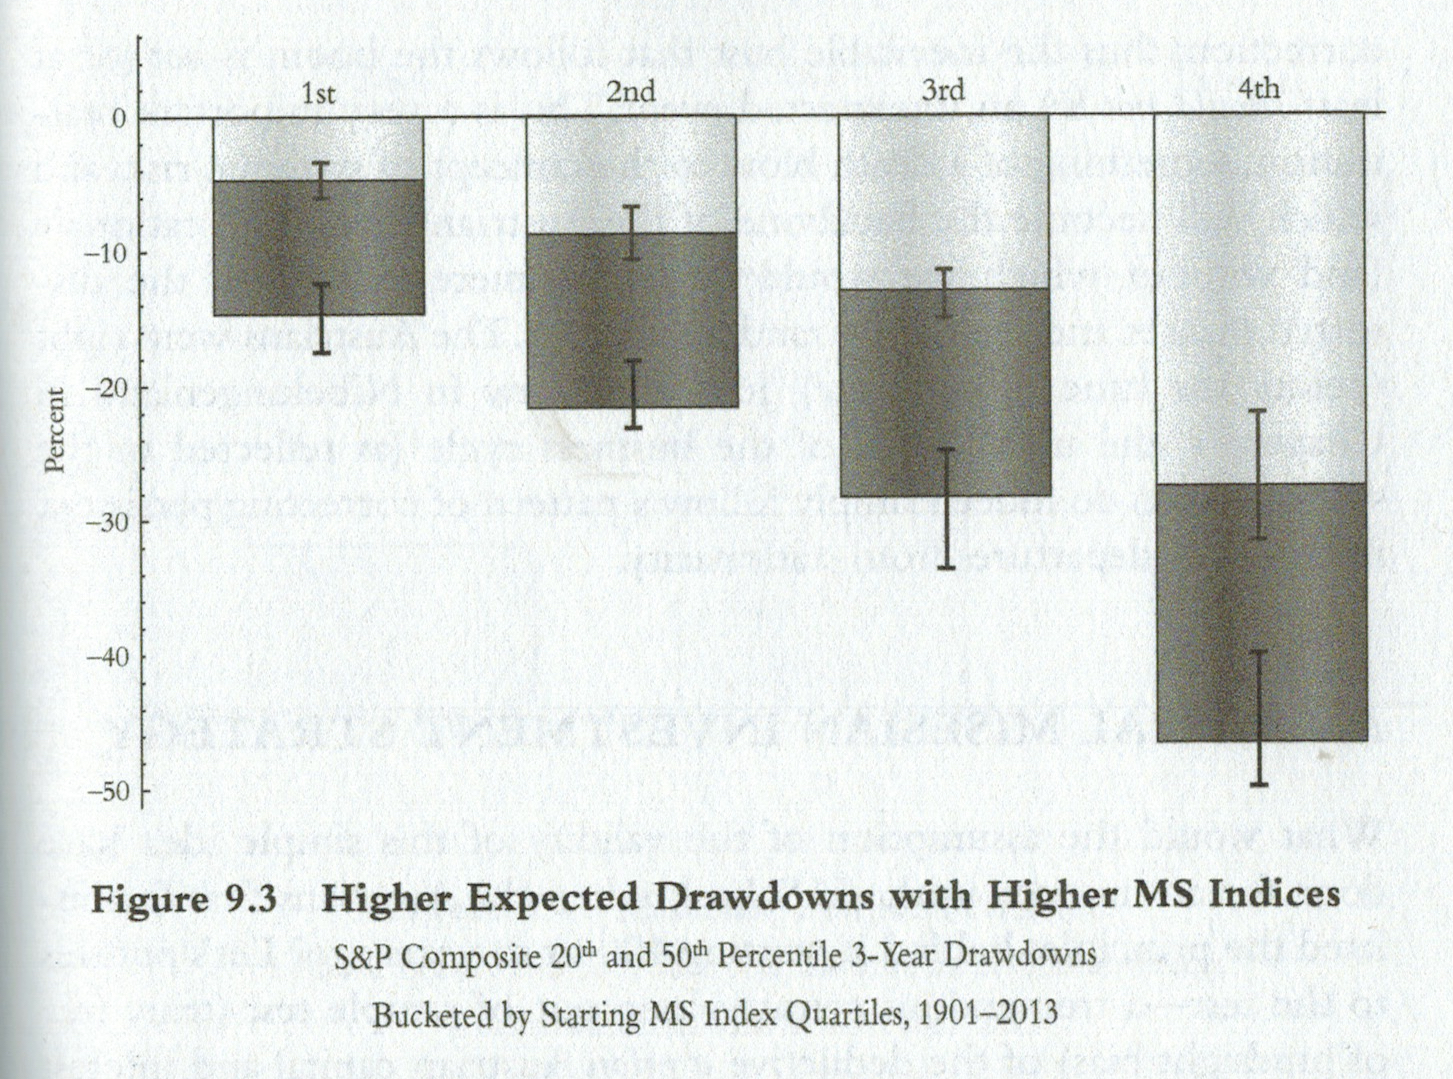
So if you care about forward returns relative to potential drawdowns, the Q-Ratio is something you probably want to pay very close attention to. Clearly, it has great value in determining this reward-to-risk ratio that is critical to the investment process. And, like other measures, the Q-Ratio is currently suggesting investors are taking a great deal of risk for very little in the way of potential reward.
How the Q-Ratio comes to be so skewed is different topic altogether and something you’ll learn in reading the book. But here’s a hint. And if you need further incentive to pick up a copy, Spitznagel also includes a couple of simple strategies built around the Q-Ratio that handily beat a buy-and-hold approach. > From <https://thefelderreport.com/2016/05/04/why-tobins-q-should-make-you-more-cautious-towards-the-stock-market-today/>
