TobinQ
One thing that really jumped out at me while reading it was Spitznagel’s research regarding Tobin’s Q, (though he calls it, “The Misesian Stationarity Index”). It struck me for two reasons. First, I haven’t seen much research like this elsewhere and second, the opinions I have seen regarding it are all of a dismissive nature. Just Google “Tobin’s Q” and you’ll find all sorts of pieces proclaiming, ‘Don’t worry about Tobin’s Q,’ and, ‘Tobin’s Q is not an effective way to time the market,’ etc. Actually, both of these sentiments are incorrect. Spitznagel’s research published in the book shows investors should be worried about the extreme level of Tobin’s Q today for the simple fact that is a very good way to time the market. But before I get into that I should probably explain what the ratio is. It’s pretty simple, really; the Q-Ratio is just the total value of the stock market (numerator) relative to the total net worth of the companies that comprise it (denominator). The data is provided quarterly by the Fed. When the Q-Ratio is very low, stocks, as a group, are inexpensive relative to their replacement cost. Conversely, when the ratio is very high, stocks are relatively expensive in this regard. Critics have suggested this way of thinking about the stock market is outdated. In other words, “this time is different.” And even if they admit that comparing equity valuations to net worth has some value they insist that value does not include timing the market. However, Spitznagel shows that when you separate the historical record of the ratio into quartiles and compare forward returns to the risk-free rate, stocks have performed very poorly after very high q-ratio readings. They also performed very well after very low q-ratio readings. Once again, it turns out that, “the price you pay determines your rate of return,” is validated by the data.
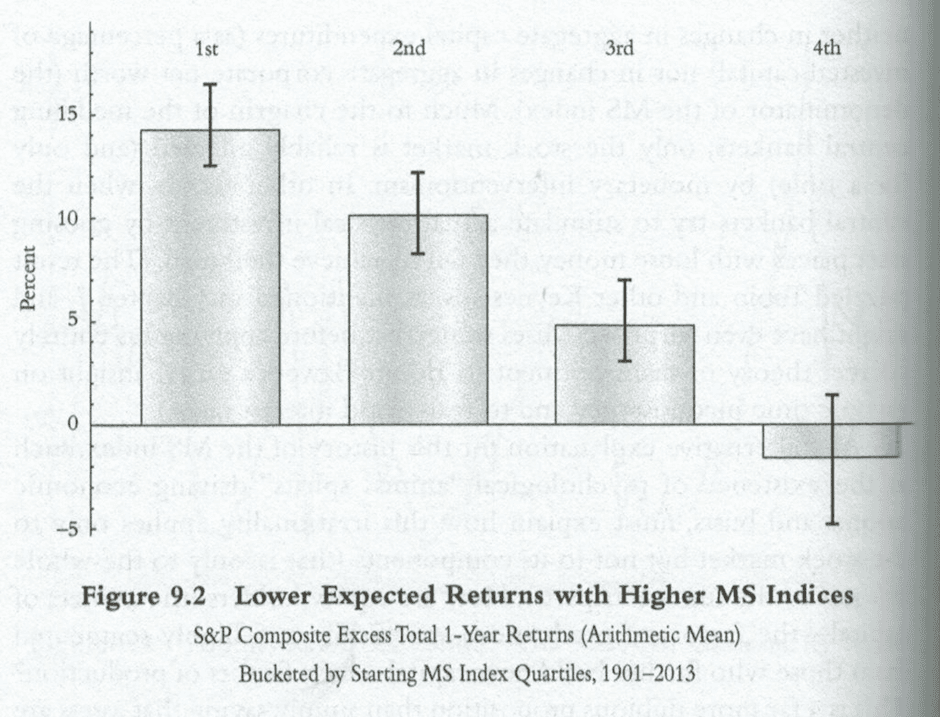
Additionally, when the Q-Ratio has been very high, as it is today, the size of the subsequent drawdowns were much larger than those following low readings in the ratio. In other words, when stocks become largely very expensive, as they are today (see the chart at the top of this post) we should come to expect large losses.
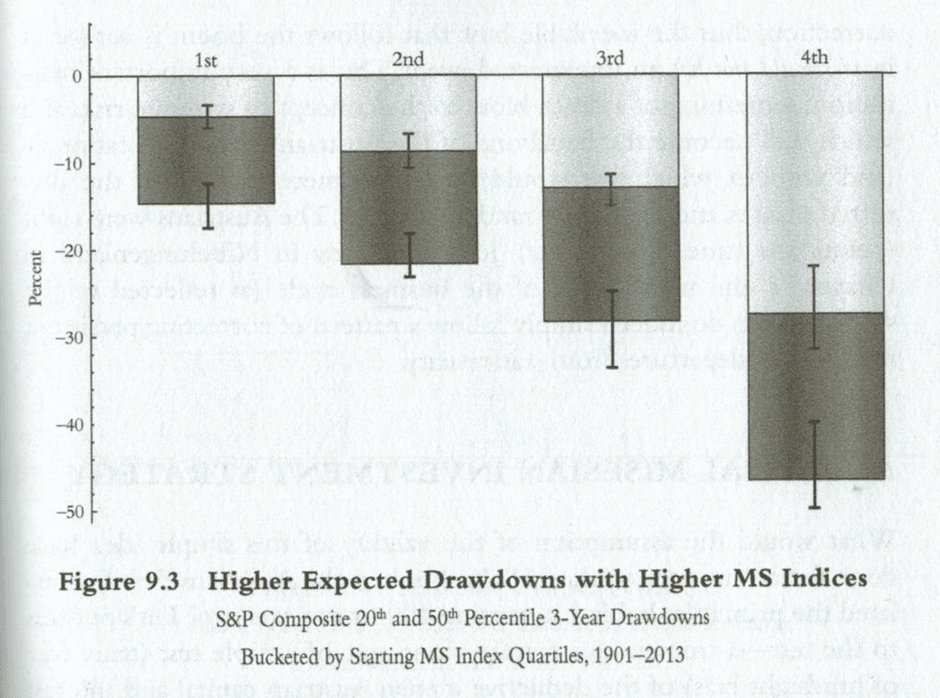
So if you care about forward returns relative to potential drawdowns, the Q-Ratio is something you probably want to pay very close attention to. Clearly, it has great value in determining this reward-to-risk ratio that is critical to the investment process. And, like other measures, the Q-Ratio is currently suggesting investors are taking a great deal of risk for very little in the way of potential reward. How the Q-Ratio comes to be so skewed is different topic altogether and something you’ll learn in reading the book. But here’s a hint. And if you need further incentive to pick up a copy, Spitznagel also includes a couple of simple strategies built around the Q-Ratio that handily beat a buy-and-hold approach.
Universa strategy
First, he uses Tobin’s Equity Q as a barometer of market exuberance: when a stock’s market valuation far eclipses the replacement cost of the equipment, intellectual property, etc. – the cost of replicating the business – that means the market’s about to undergo a steep correction.
Corollary to this is the use of strategic put options – insurance if you will – to protect one’s portfolio against these inevitable draw-downs, while at the same time benefiting from a basket of stocks on the long side.
According to Mark Spitznagel, the two criteria for what makes a stock worthy of inclusion in our hypothetical portfolio is a high Return On Invested Capital (ROIC), ideally above 100%.
A high ROIC is only half the story, however, because stocks should also have a low Faustmann Ratio – the ratio between the market capitalization of a company and its net worth.
Now, this Faustmann Ratio is somewhat tedious to calculate, but the operating principle here is similar to Tobin’s Equity Q: it only makes sense to invest in a company when it is being undervalued by market participants.
In other words, a company is thought to be undervalued when the market capitalization is equal or lower to the net worth, which is the sum of a company’s invested capital and its cash balance minus the debt and preferred equity.
