Market Winners & Draw Downs
Gold is correlated to inflation In 1996, one dollar bought more than 120 milligrams of gold. Today in March 2026, it buys fewer than 10 mg.
Since 1980 3 out of 4 months are down to all time high. Median draw down is 8%
- 25% of drawdowns are 17% down
- 10% of drawdowns are 29% down
Spaarrente
Historisch hoogtepunt (1980) 11,6% Begin jaren ’90 ~8% Rond 2000 ~2,5% Laagtepunt (tot 2022) Minder dan 0,3% Huidig (top, maart 2025) 1,90% – 2,01% Aan het begin van de jaren ‘90 waren spaarrentes tussen de 6% en 8% heel gebruikelijk. Van 1994 tot 2004 daalde de spaarrente van 6,5% naar 1,8%. Van 2019 tot 2022 hadden we te maken met zeer lage rentes die maar net (of soms zelfs onder) de 0% lagen. In 2022 stegen de spaarrentes weer, omdat de ECB de depositorente verhoogde met als doel de inflatie af te remmen. Sinds eind 2023 is er juist weer een stabilisatie/daling te zien, nu de inflatie in heel Europa is afgezwakt.
19-02-2026 In recent weeks, short, sharp sell-offs across the largest global artificial intelligence (AI) hyperscalers have woken investors from their technology and AI-inspired slumber. In just six trading sessions, Microsoft fell 18 per cent. Meanwhile, Amazon has declined 14 per cent in eight sessions, and Google parent Alphabet has fallen 8 per cent in just four sessions. Elsewhere, Meta fell 10 per cent, and Tesla has declined almost 12 per cent in 10 trading sessions.
Not all sell-offs have been short. Zoom out and, over the last 90 days, Coinbase has slumped 48 per cent, Oracle and Atlassian have fallen 41 per cent, PayPal has dropped 39 per cent, Snowflake is 37 per cent lower, as is Roblox, while Intuit and Spotify are 32 per cent lower, Palantir and Shopify have declined 29 per cent, and Cloudflare, CrowdStrike and Workday are 27-29 per cent lower.
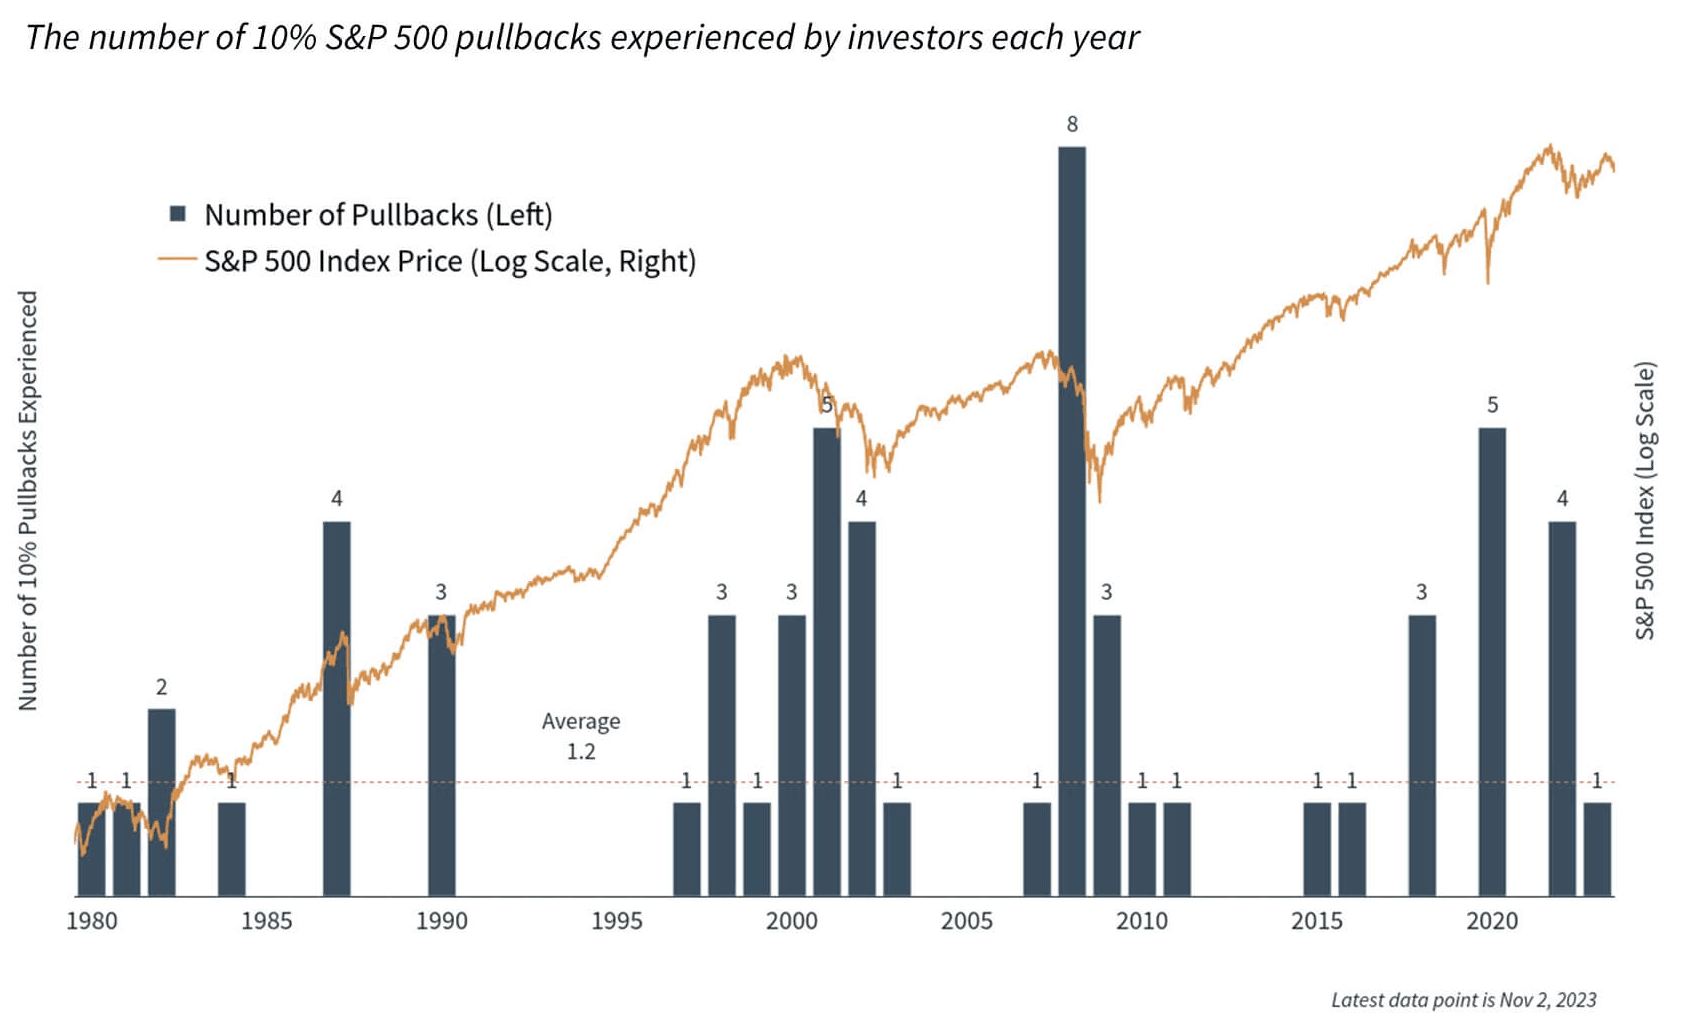
Strong growth rates have only occurred a few times over the past two decades – prior to 2021, it last occurred in 2014, and before that in 2006.
| Company | Gains | Info |
|---|---|---|
| Nvidia | +35% | |
| Fresnillo | +443% | Precious metal mining |
| Robinhood | +229% | |
| SK Hynix | +234% | |
| Rheinmetall | +151% | |
| German Renk | +191% | gearboxes for tanks |
| Babcock International | +151% | |
| Société Générale | +150% | |
| Santander | +123% | |
| Year 2025 |
A history of declines (1954–December 2023)
20% drop in one month (happened twice)
| Type of decline | Average frequency* | Average length† |
|---|---|---|
| –5% or more | About once a year | 101 days |
| –10% or more | About once every 30 months | 234 days |
| –15% or more | About once every 5 years | 345 days |
| –20% or more | About once every 6 years | 370 days |
1950s and 1960s, the daily changes in the level of stock prices typically exceeded 2 percent only three or four times per year. But in the year ended July 30, 2008, we’ve witnessed 35 such moves—14 were up, and 21 were down. Based on past experience, the probability of that scenario was … zero.
Thus, a VIX above certain thresholds could be more informative. It is critical to distinguish the roles of normal VIX and high VIX. We therefore select dynamic thresholds for the VIX
The 7% Rule in trading means you should sell a stock if its price drops 7% below what you paid for it. This rule helps you cut losses early and protect your investment capital. It also takes emotion out of trading decisions, which is important during volatile market periods.
2020 COVID Crash
The time leading into the start of the COVID-19 pandemic was characterized by a lot of uncertainty among investors and some significant market volatility. Between February and March 2020, the S&P 500 fell ~34% in a month. This time also saw a historic VIX spike that went above a level of 80. Though it was a time of apprehension among investors, there were ways that some capitalized on the conditions, implementing strategies like selling put options or using long VIX calls.
February and March of 2020 also saw massive Fed intervention through major interest cuts and quantitative easing. Interest rates were brought down either to 0% or close to it (0.25%), and it was done to lower the borrowing costs for businesses and households as a way to stimulate the economy. In terms of quantitative easing, the Fed bought up large quantities of mortgage-backed securities and Treasury securities to inject cash back into the economy and stabilize the markets.
2022 Bear Market
This period of the US economy was notable for being affected by rising interest rates and high inflation levels. The Fed increased interest rates to combat rising inflation, which led to a slowdown in the economy as it became more expensive for families and businesses to borrow money. The S&P 500 was down ~20% YTD by the end of 2022.
Due to the Fed rate hikes and inflation fears, the bear market of 2022 was longer and more drawn-out, lasting for several months. During that time, the S&P 500 experienced its worst year since 2008, and the financial crisis that was notable that year. Another contributing factor that made things worse during this period of 2022 was supply chain issues caused by the war between Russia and Ukraine.
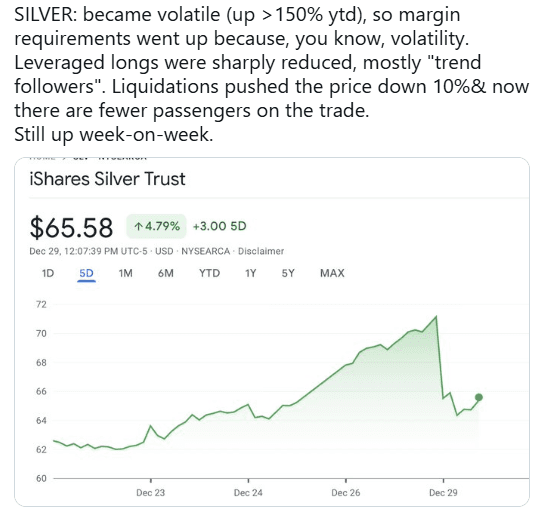
On December 29, 2025 the silver price fell sharply by 9%. The silver crash has nothing to do with industrial demand or jewellery. It results from excessive leverage, tightened margins, and forced liquidations in a chain reaction. When volatility rises, margin calls force positions to be liquidated one after the other. The next day a partial rebound of +3.1%.