Findings and Analysis
We analyzed 79 events from the November 2024 election, looking at only elections primarily contested between a Democrat and a Republican (more details + dataset + code snippets at end of article).
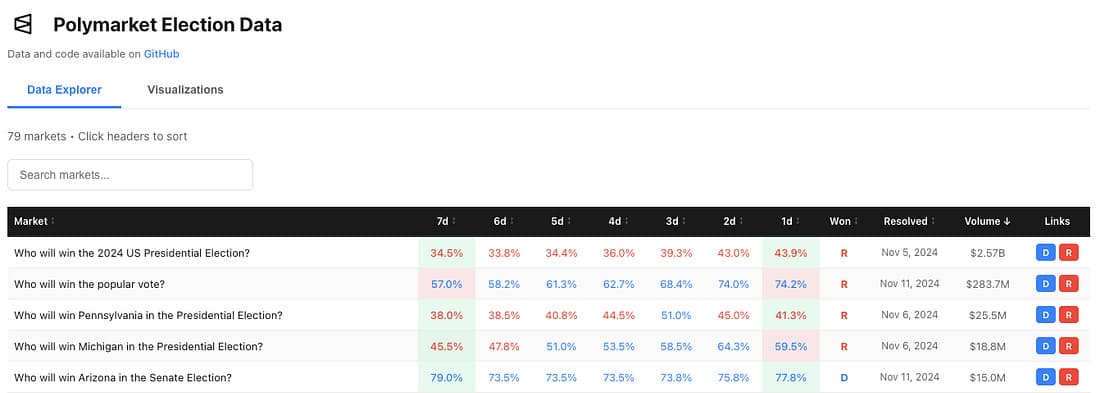
Click for full dataset
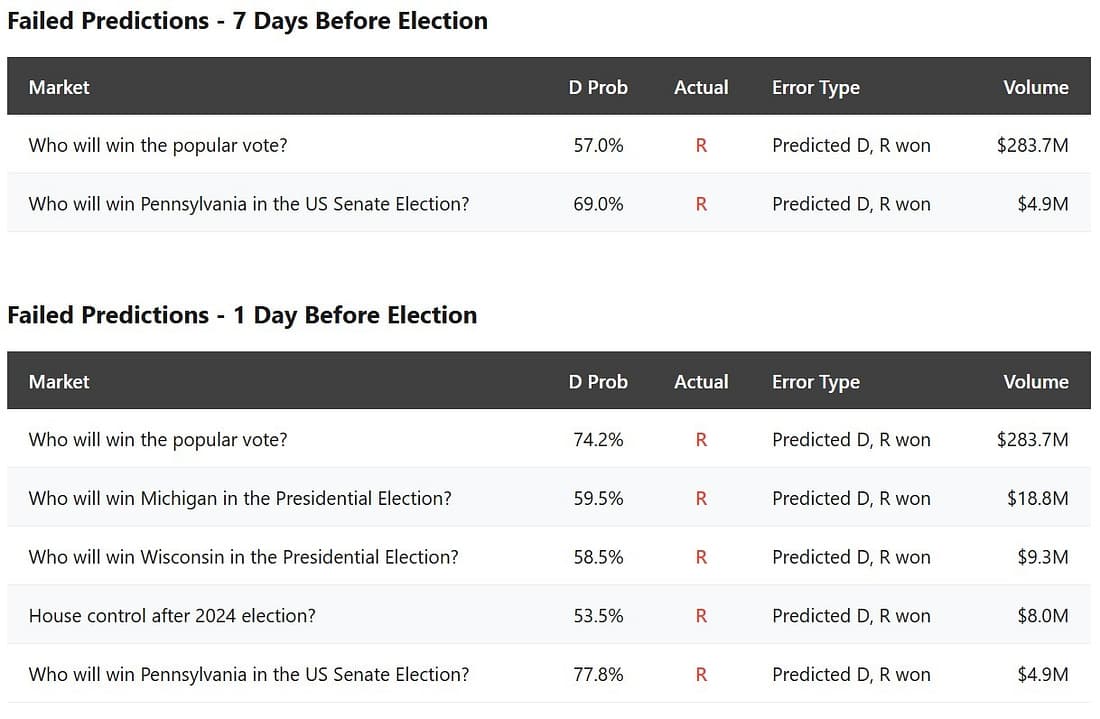
Polymarket traders were correct for 77 (97.5%) of them 7 days before closing, and 74 (93.7%) of them 1 day before closing. Among these 79 events, Republicans won 48 while Democrats won 31.
Looking at where the inaccuracies fall, we see that they actually display a tendency to be overconfident in Democrats.
The figures below, known as “confusion matrices” display predictions vs reality. Here is how to interpret the chart below:
-
Top left box: how many elections traders predicted would be won by the Republican AND were actually won by the Republican
-
Bottom right box: how many elections traders predicted would be won by the Democrat AND were actually won by the Democrat
-
Top right box: how many elections traders predicted would be won by the Democrat BUT were actually won by the Republican
-
Bottom left box: how many elections traders predicted would be won by the Republican BUT were actually won by the Democrat
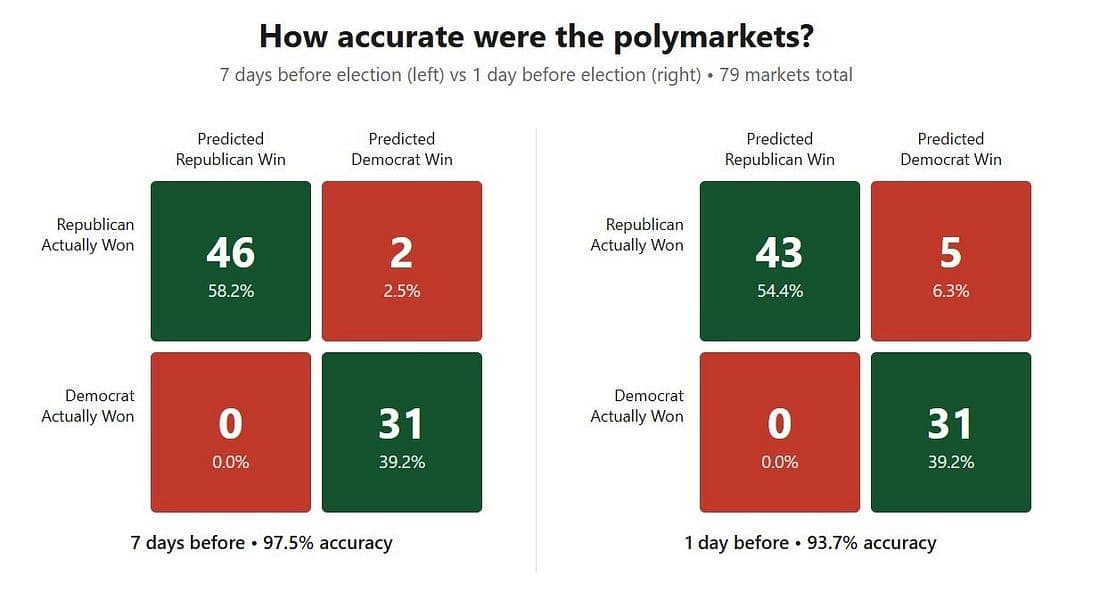
At both the 7 day and 1 day time horizons, there are several markets where traders predicted a Democrat win, but in reality a Republican won (top right), while there are no cases where the opposite was true (bottom left)
 |
Going one step further, we can also look at the raw probabilities to compare confidence in predictions by measuring a quantity called directional bias.
Imagine if, in 100 coin flips, you guess a coin flip to be heads 60% of the time, but heads only comes up 50% of the time; you have a clear bias toward heads - you kept thinking heads was more likely than it actually was. In this case, your directional bias would be 60% - 50% = 10%.
Our dataset showed a pro-Democrat directional bias of ~3.6% at a 7 day time horizon and ~6.3% at a 1 day time horizon.
