Historic properties
“FANG,” comprised of Facebook (now Meta), Amazon, Netflix, and Google (now Alphabet), as a shorthand for the best performing technology stocks on the market. Apple, added in 2017, made it FAANG.
| Company | Symbol | Weight | Price |
|---|---|---|---|
| Nvidia | NVDA | 20.65% | 183.22 |
| Apple Inc | AAPL | 18.57% | 270.90 |
| Alphabet Inc | GOOG | 17.43% | 311.49 |
| Microsoft | MSFT | 16.73% | 485.36 |
| Amazon | AMZN | 11.32% | 228.39 |
| Meta Platforms | META | 7.73% | 661.28 |
| Tesla Inc | TSLA | 7.56% | 489.98 |
| Date: 22 DEC 2025 |
| Company | Value £ (GBP) | Value $ (USD) | Change 2025 |
|---|---|---|---|
| Meta | £990 billion | $1.3365 trillion | +35% |
| NVIDIA | £1.3 trillion | $1.755 trillion | +34% |
| Amazon | £1.4 trillion | $1.89 trillion | +13% |
| Microsoft | £2.4 trillion | $3.24 trillion | +9% |
| Alphabet | £1.4 trillion | $1.89 trillion | +1% |
| Apple | £2.3 billion | $3.105 billion | -3% |
| Tesla | £452 billion | $610.2 billion | -26% |
| 📌 Notes: Conversions use the rate 1 GBP = 1.35 USD @ 23 DEC 2025. |
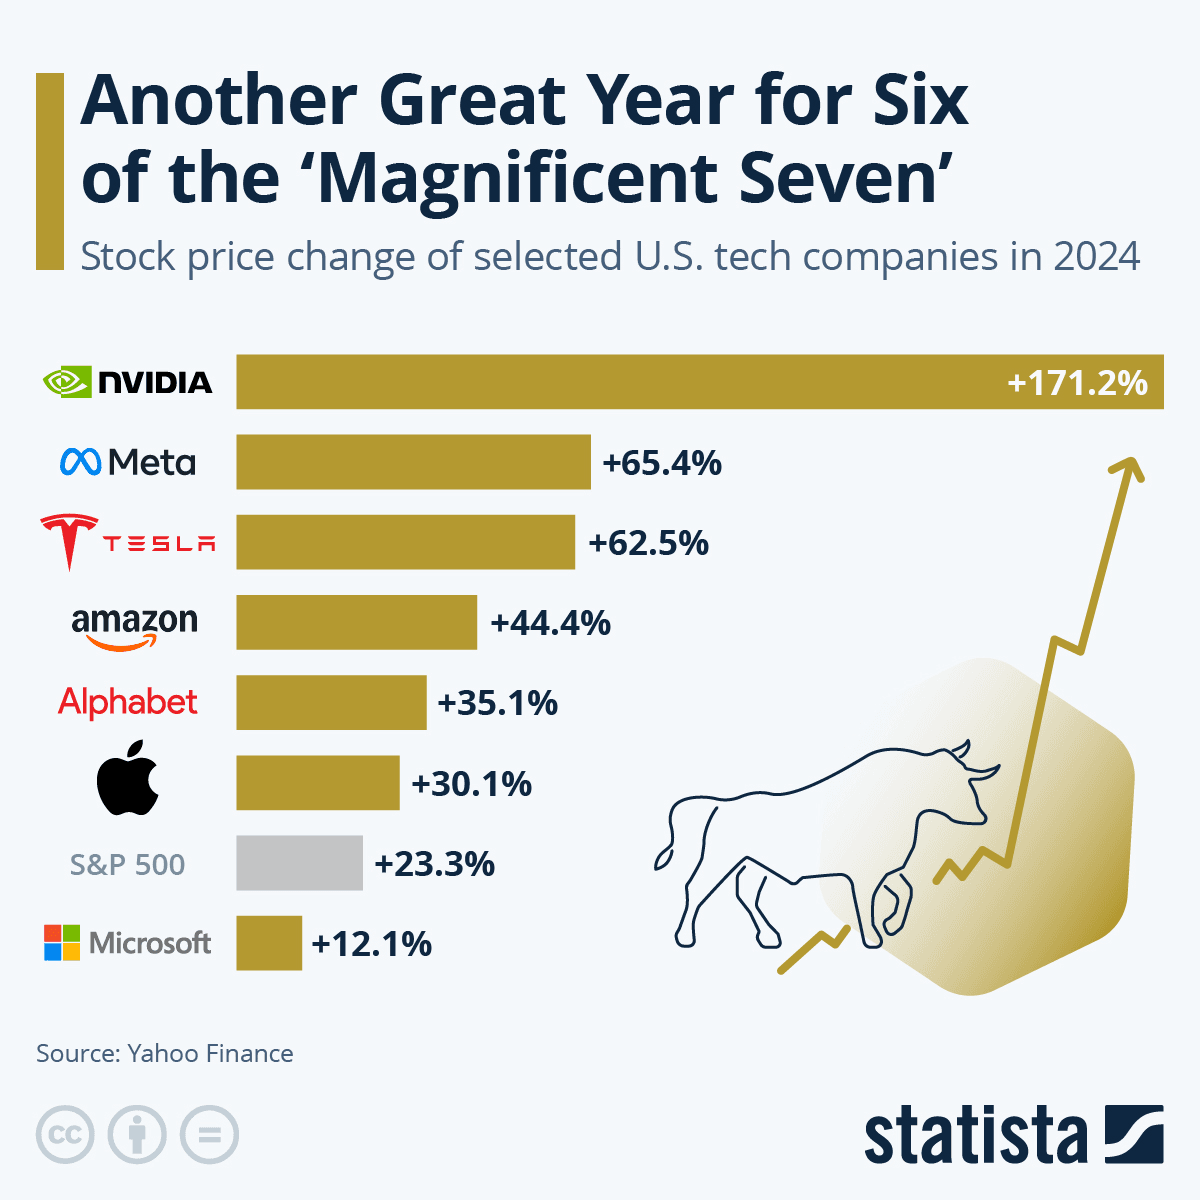
Microsoft's investment in AI - capital expenditure surged 75 percent to $55.7 billion in the fiscal year ended June 2024. The Magnificent Seven accounted for more than half of the S&P 500 25-percent return last year, with Nvidia alone contributing more than 20 percent.
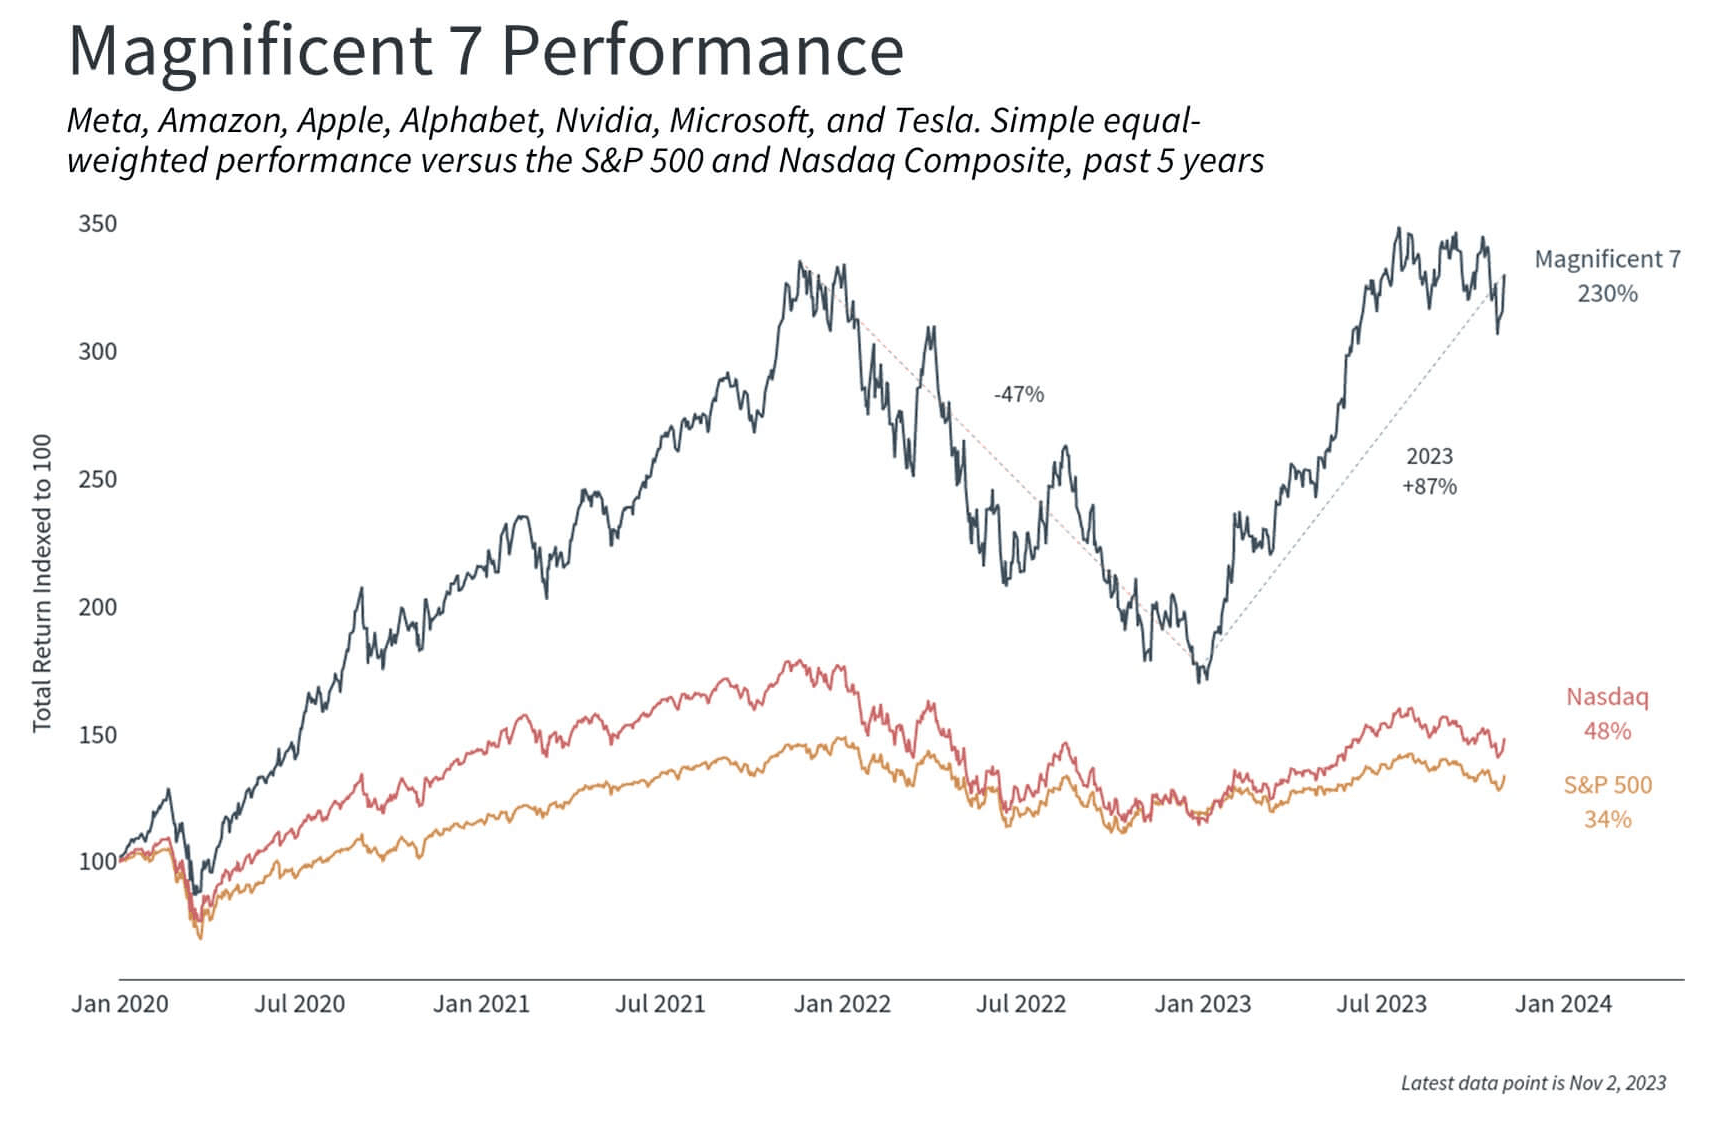
Here’s a look at the companies ranked by their market capitalization on November 6, 2023, alongside their 5-year stock performance:
| Rank | Company | Market Cap | 5 Year Performance |
|---|---|---|---|
| 1 | Apple | $2.8 trillion | +250% |
| 2 | Microsoft | $2.6 trillion | +224% |
| 3 | Alphabet | $1.6 trillion | +141% |
| 4 | Amazon | $1.4 trillion | +63% |
| 5 | Nvidia | $1.1 trillion | +783% |
| 6 | Meta | $811 billion | +118% |
| 7 | Tesla | $690 billion | +829% |
The Magnificent Seven make up more than one-quarter of the S&P 500 and more than half of the Nasdaq 100.
