Monte carlo
Meet 1000 path of MSFT simulation using Jump Diffusion. I’m interested in the mean of the terminal prices. I am interested in 1 Day ahead, 1 Week ahead, 30 days and 1 year. Simulation is based of historical mean, option markets implied vol from the 30 day out calls and any jumps above 5% + 4 earnings surprises for jump rate and magnitude
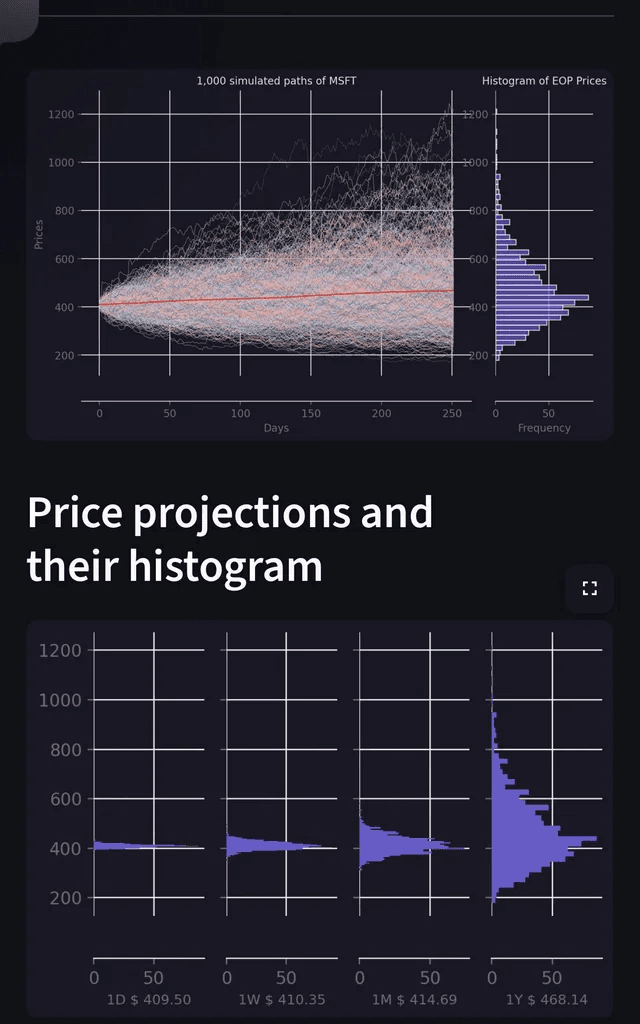
Big picture: Quantifiable way of saying in the long run it’s anyone’s guess where the asset will end up and as time goes on error accumulates thus the cone structure.
That's Monte Carlo. You replace single-point guesses with ranges, run thousands of scenarios, and get a distribution of possible outcomes instead of one fake-precise number.
What you actually get:
- The most likely outcome (mean/median of the distribution)
- How wide the uncertainty is (the “cone” you see in those charts)
- Tail probabilities — e.g., “there's a 5% chance of losing more than X”
- Which inputs drive the most uncertainty (sensitivity analysis)
Excel example
The lookup table is in A2:B30. The formulas for the random data and related frequency table are:
copy down appropriately
E2: =ROUND(FORECAST(RAND(), OFFSET($B$2, MATCH(RAND(), $A$2:$A$30, -1)-1, 0, 2), {0,1}), 4)

G2:G44: =FREQUENCY(E2:E1255, F2:F43)
The MATCH expression is similar to VLOOKUP, in effect. The FORECAST expression interpolates between two adjacent data points, based on the frequency data.
